Variable list
The relative wall roughness is defined

With K as average height of all elevations.
Table 1 – Reference values for technical tubes:
|
Material |
Condition |
Wall roughness |
|
Drawn glass, lead, copper or brass tubes |
|
0 to 0.0015 |
|
Drawn steel tubes |
New |
0.04 (0.02 to 0.1) |
|
Cleaned after long service |
0.15 to 0.20 |
|
|
Moderately rusted or slightly fouled |
Up to 0.40 |
|
|
Heavily fouled |
Up to 3.0 |
|
|
Galvanized sheet steel |
Smooth (air ducts) |
0.07 |
|
Galvanized steel tubes |
Normally galvanized |
0.15 |
|
Welded steel pipes |
New |
0.05 (up to 0.1) |
|
New, bituminized |
0.05 |
|
|
Used, cleaned |
0.15 – 0.20 |
|
|
Uniformly rusted |
Up to 0.40 |
|
|
Slightly fouled |
1 – 1.5 |
|
|
Heavily fouled |
2 - 4 |
|
|
Riveted steel pipe |
|
0.9 (0.5 up to 1) |
|
Cast iron pipes |
New |
0.26 (up to 1) |
|
New, bituminized |
0.10 – 0.15 |
|
|
Slightly rusted |
1.0 – 1.5 |
|
|
Fouled |
1.5 – 4.0 |
|
|
Concrete conduits |
Smooth finish |
0.3 (up to 0.8) |
|
Rough |
1.2 (up to 3) |
|
|
Fibrous concrete pipes |
(Eternit, Toschi) |
0.05 to 0.1 |
|
Wooden boards |
Unplaned |
0.7 |
|
Planed |
0.2 |
|
|
Brickwork |
Normal bonds |
1.3 |
|
Plastic tubes |
|
Up to 0.0015 |
The constant KG varies from 0.02 to 0.03. Minimum values are used for fine particles with great angles of repose the maximum value for rough particles with small angles of repose. For the majority of dusts is KG = 0.025.
Figure 11 shows grading curves of E- Filter- cement dust. Curves 2 and 3 are moved in parallel with increasing load of the specimen with magnetic stirrer and ultrasound.

Figure 11. Residue curves for agglomerating dusts
In cyclones for similar cases, it is valid:
|
|
(52) |

This factor lies in the range of 1.2 and 1.3. It serves for adjusting the calculated limiting particle diameter to experiments. It is pre-defined with 1.25.
Adjustment of the calculation to reflect the type of feed. It varies from 0.005 and 1 (sphere = 1)
Is pre.defined according to Meissner as =0.0075
This variable is used for an improved calculation of the pressure drop. It takes in to account the influence of strands of solid.
The void fraction of strands of solids is approximately double the size of the cavity volume of the bed of solids. The density of the bed of solids results from the particle density and the void fraction of the solid.
|
Curve |
a |
b |
c |
|
Construction type |
|
|
|
|
Inlet |
axial |
tangential |
tangential |
|
h/ri |
15.0 |
13.0 |
10.0 |
|
hi/ri |
10.0 |
10.0 |
7.5 |
|
ra/ri |
2.0 |
3.0 |
4.0 |
|
Ae/Ai |
2.70 |
0.90 |
0.44 |
|
b/ra |
0.40 |
0.27 |
0.19 |


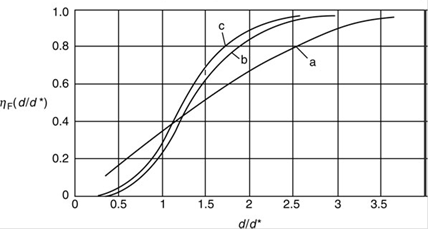
Separation efficiency curves of different cyclone types
Separation curves may be entered by means of using the option “Edit separation curve”