Description of the menus
The usual functions to open, to save and to exit the program are provided here. The current pipe network can be saved if required or be loaded as a file. Some menu items may be shaded when they cannot be selected, e.g. saving is not possible after starting the program as long as no data has been entered.
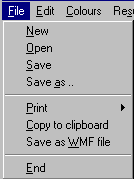
For documentation purposes the graphics can be copied to the clipboard, saved as a WMF file or printed as a complete or partial picture.
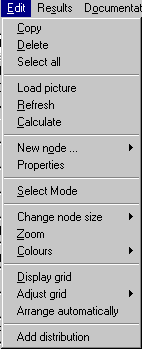
The "Edit" menu provides options to modify parts or the entire pipe network. When the program is started it is in the "Drawing mode" where new gussets and pipes can be created. To move, delete or copy parts of the pipe network switch into the "Select mode". Parts of the network are selected by dragging with pressed right mouse key. After that, the selected areas can be manipulated with the other menu items.
The present mode is shown at the bottom of the drawing area in the basic mask.
The menu item „Load picture“ allows the merging of a bitmap file on a selected node (pump, outlet...)
The menu item "Calculate" has the same function like clicking on the calculation icon in the symbol list on the left screen margin.
The menu items
- new node
- supply (fixed pressure)
- fixed flow inlet
- pump
- outlet
- Free outlet
- nozzles
- properties
- correspond to the functions of the icons on the left screen margin.
The menu item ’Change node size‘ enables you to choose between four standard sizes for the graphical display of the nodes. In bigger systems it might be helpful to change the size of the nodes to increase the clarity of the diagram.
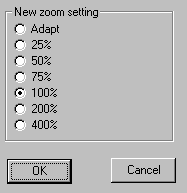
With the menu item "Zoom" the viewing area can be zoomed larger or smaller:
With the "Colours" menu the appearance of the pipe network can be designed individually.
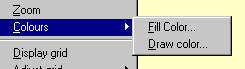
Use different draw colours to emphasize relevant runs and nodes.
Example:
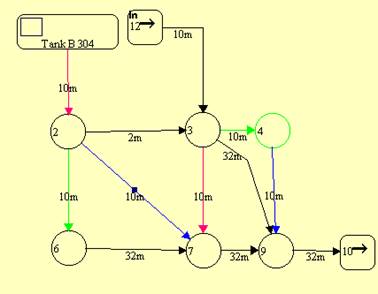
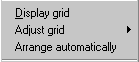
The menu items „Show grid“, „Adjust grid“,and „Arrange automatically“ in the „Edit“ menu allow to create horizontal or vertical connections of nodes.
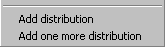
Distributing or collecting currents in pipes or purging through many openings is quite important for many practical applications.
The menu item ‚Add distribution‘ in the ‚Edit‘ menu enables you to insert several distribution systems according to the desired process.
Different types of distribution systems:
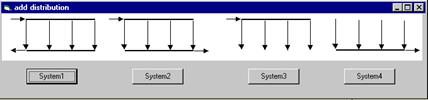
Closed systems:
- Symetrical (system1): Inlet or outlet of the medium are on the same side as the collectors.
- Asymetrical (system2): Inlet or Outlet of the medium are on the oppsite of the collector.
Open systems (system3 / system4):
The medium is either distributed or collected by a pipe system.
The menu item ‚add one more distribution‘ creates a meshed network without inlets or outlets. This procedure enables you to e.g. connect parallel distributions or subdistributions to an existing system. Please note that the connection cannot be made automatically.
With the "Results" menu the calculated values can be represented in the graphics.
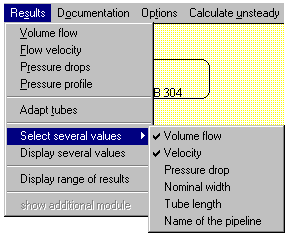
The desired variable (volume flow, flow velocity, pressure drops, pressure profile) is entered in the graphics on the pipes. It is possible to represent several of these variables at the same time. Select the desired variable by clicking on the submenu as shown above.
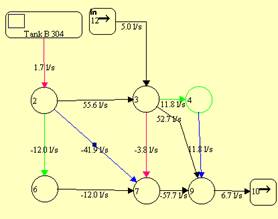
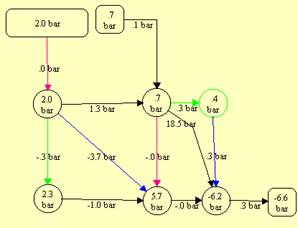
See ‚Documentation‘ menu!
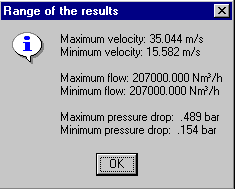
The menu item ‚Display range of results ‚ displays the maximun and minimum values of the velocity, the flow and the pressure drop.
With the menu item "Adapt tubes" the nominal widths of the pipe network can be adapted automatically by the program to a defined minimum and maximum velocity.
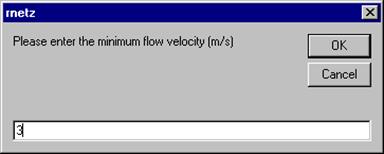
If the set velocities have not been attained after one computing run the program asks whether the adaptation has to be continued.
For the adaptation of the pipes only standard nominal diameters are considered.
The "Documentation" menu is for the documentation of the input data.
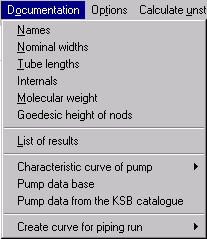
With the menu item "Names" the descriptions of the pipes specified during the input of the pipe data are displayed. With "Nominal widths" and "Tube lengths" the selected data are displayed in the basic mask. „Internals“ displays the modules of the piping network.
The menu item 'Molecular weight' shows the mean molar mass of the medium calculated by PROPER.
'Geodesic height of nods' displays the geodesic height of all nods.
With the menu item "Characteristic curve of pump" it is possible to display or print the current assignments of the pumps to the gussets and the current operating points of the pumps.
Pump data base:
The menu item „Pump data base“ calls up a data base.
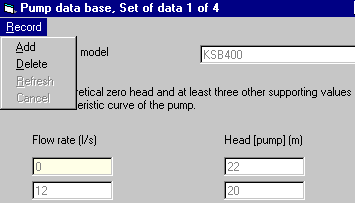
After having added a new set of data you can enter values into the input fields. In the lower part there is a navigation bar which allows you to leaf through the contents
- Adding records
Open the „records“ menu and select ‚add‘ . The contents of all input fields is deleted and you may enter a new set of data.
After having entered a new set of data you are able to save this set by selecting ‚Refresh‘ in the ‚Records‘ menu. Select ‚Cancel‘ if you want to cancel your input and you don’t want the data being saved.
Deleting records
The set of data displayed in the data base can be deleted by selecting ‚Delete‘ in the ‚Record’menu. Simply confirm your selection by clicking ‚Yes‘.
Pump data base from KSB catalogue
Select ‚Pump data from KSB catalogue‘ to call up pump data from the KSB catalogue. Your internet explore is started and you visit KSB’s homepage.
Please note: Internet Explorer must be installed on your system and an internet connection has to be established.
With "Create list" a list of pipes with the entered and calculated data is created. This list can be printed for documentation with the menu item "Print".
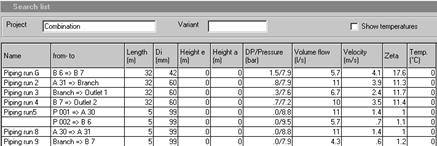
If the given heights or fittings should not be printed select the corresponding option at the top of the mask. Both options can be selected at the same time. "Print all" is the default setting which is reset when the list is started again.

With the buttons at the bottom of the screen it is possible to address the standard printer directly, to change the printer font or to save the list as file. Return to the main mask with "OK".
With the button ‘Export to Excel’ you can save the list (table) as Excel file and then format it as desired.

The button ‚Save text file‘ saves your list as a .txt file. This enables you to use your results in other programs, too.
In this item you can choose different options. Within a meshed pipe network you are asked to select a pipe run
coming from a supply, an inlet or a pump and
leading to an outlet.
You can choose between various possibilities suggested by the program.
With this option you get the velocity course of a supply pipe or a graphical representation of the height profile which is
displayed on the screen,
printed on the standard printer or
exported to EXCEL 8.0 (EXCEL 97) where it can be formatted as you like, given a comment or printed.
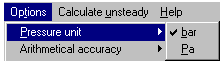
You may switch between the pressure units bar and Pa for input and documentation.
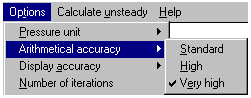
Usually, the arithmetical accuracy "Standard" is sufficient. If you need more decimal positions or a higher accuracy you can increase the accuracy. Please note that the computing time increases considerably in case of larger systems. The calculation process can be controlled or cancelled if necessary at the left-hand bottom of the basic mask.
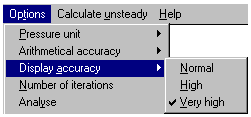
Increase the display accuracy if the displayed values are rounded too much.
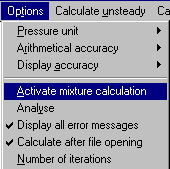
There is an interface to our properties program PROPER
The PROPER program provides the necessary properties of a liquid, gas or mixture to calculate the pressure drop and transfers the data to the ROHRNETZ program.
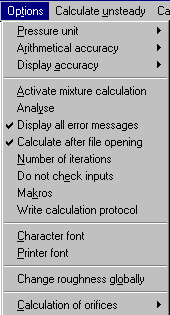
The menu item ‚Activate mixture calculation‘ in the ‚Options‘ menu calculate the properties at every mixture node of the system.
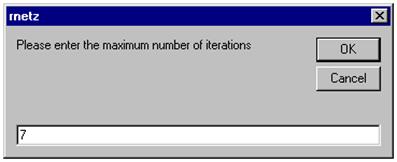
For difficult problems the standard value can be modified here.
The current usage of the resources and possible errors in the internal structure are displayed here.
When the program starts this option is not set. By marking this option possible errors during creation of new gussets and pipes are not checked, e.g. missing flow values, missing supply values, missing pipe diameters. Please choose this option only if you are an experienced user to be able to cancel faster possible incorrect inputs during creation of a pipe network.

If this option is not marked you have to complete all inputs after the creation of a gusset or a pipe first.
After selecting the item "Calculation method" the file ReWe.dat is opened in the current directory. Information about the internal course of the calculation and about errors are recorded in this file. The file is saved, when the menu item is selected again or when the program is finished properly. The file is overwritten without query (when created again).
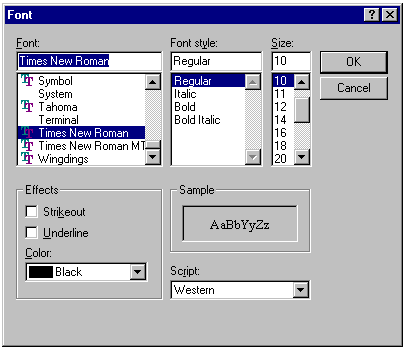
The font type for display can be set here. For a font type smaller than suggested, overwrite the field "Size" by a smaller value, e.g. 4.
See descriptions in chapters "Character font" and "Formatting the printer output".
To change the roughness values of all existing pipes at the same time, you can do the corresponding settings here.
With the menu item 'calculation of orifices' in the 'options' menu you can calculate the pressure loss of orifices according to "VDI" or "Potter".
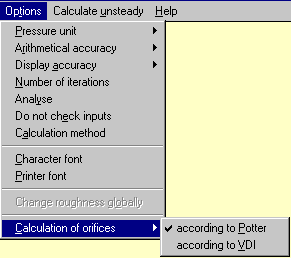
Example: You have calculated a pressure loss according to "Potter" and now you want to calculate it according to "VDI".
§ By clicking the pipe run (orifice), the following mask appears
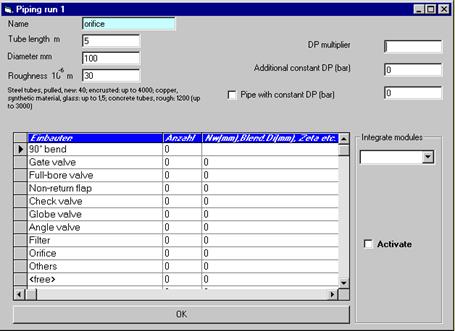
§ Confirm with OK
§
Start calculation by clicking this button  .
.
§ After having performed the calculation, the program transfers the results automatically to your graphics.
This menu is shaded and cannot be selected if:
you have purchased the program ROHRNETZ (PIPE NETWORK) without the additional module KV.
you have selected the medium Gas or Vapour. At the moment the calculation is possible for incompressible mediums only.
you don’t have the license to use additional modules. Please contact us for the necessary new installation by phone +49-721-978220.
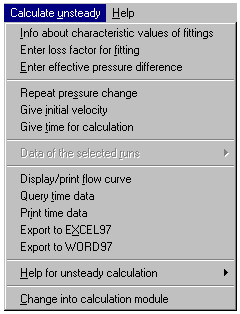
Some typical pressure drop factors for fittings are listed to make input easier for you.
For performing unsteady calculations the specification of a pressure drop factor for the open fitting is necessary.
Note: An unsteady calculation is only possible if a fitting is opened or closed, e.g. a regulating valve.
The value must be greater than 0.
A change of pressure results in an unsteady flow.
Here you can enter the effective pressure difference.
With this menu item the pressure change is applied once more.
You can give a fixed initial velocity in the pipe runs connected to the additional module KV for the unsteady calculation. If no value is entered the idle state is assumed.
In this menu item you can give a time for the calculation. If you don’t enter a value the pipe network is calculated after having reached the steady state.
This menu item is enabled only if
at least one pipe run has been linked to the additional module KV for unsteady calculation and
at least one further pipe run has been selected by marking in the pipe input mask for the determination of the unsteady data:
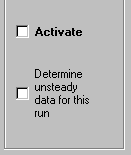
The displayed detail of the input mask for the pipe data only appears if at least one pipe run has been linked to the additional module KV.
The program displays the time dependent data of the pipe run which is observed during the time dependent calculation. Therefore, it is not the pipe run linked to the module KV; it has to be connected to an inlet or outlet.
In the submenu:

the names (descriptions) of the selected pipe runs and the temporal course in a pipe run can be displayed for checkup.
In this menu item you can find the graphical representation of the temporal course in the pipe run linked to the module KV.
Note: If several runs are linked to the module KV, it is possible to display one run only.
With this menu item the data of a pipe run linked with the module KV are represented. Unsteady data are also printed and exported.
Further information for doing time dependent calculations is provided in this submenu.
With this menu item you switch to the calculation mask of the additional module KV where you can do e.g. a parameter study. Further help for working with the modules of the program package ATLAS is provided in the ATLAS help.
This menu opens the online help.